

Management Information (MI) is always high on an Insurance Company’s agenda, but was previously too costly. Deliver your strategic MI now in just 1 week at a fraction of the cost!
This ranges from MGA Startups with very little data to National Insurers and Brokers with 20+ years of policy history.
EiB Insurance Analytics delivers a complete and fully automated set of dashboards & reports from your data
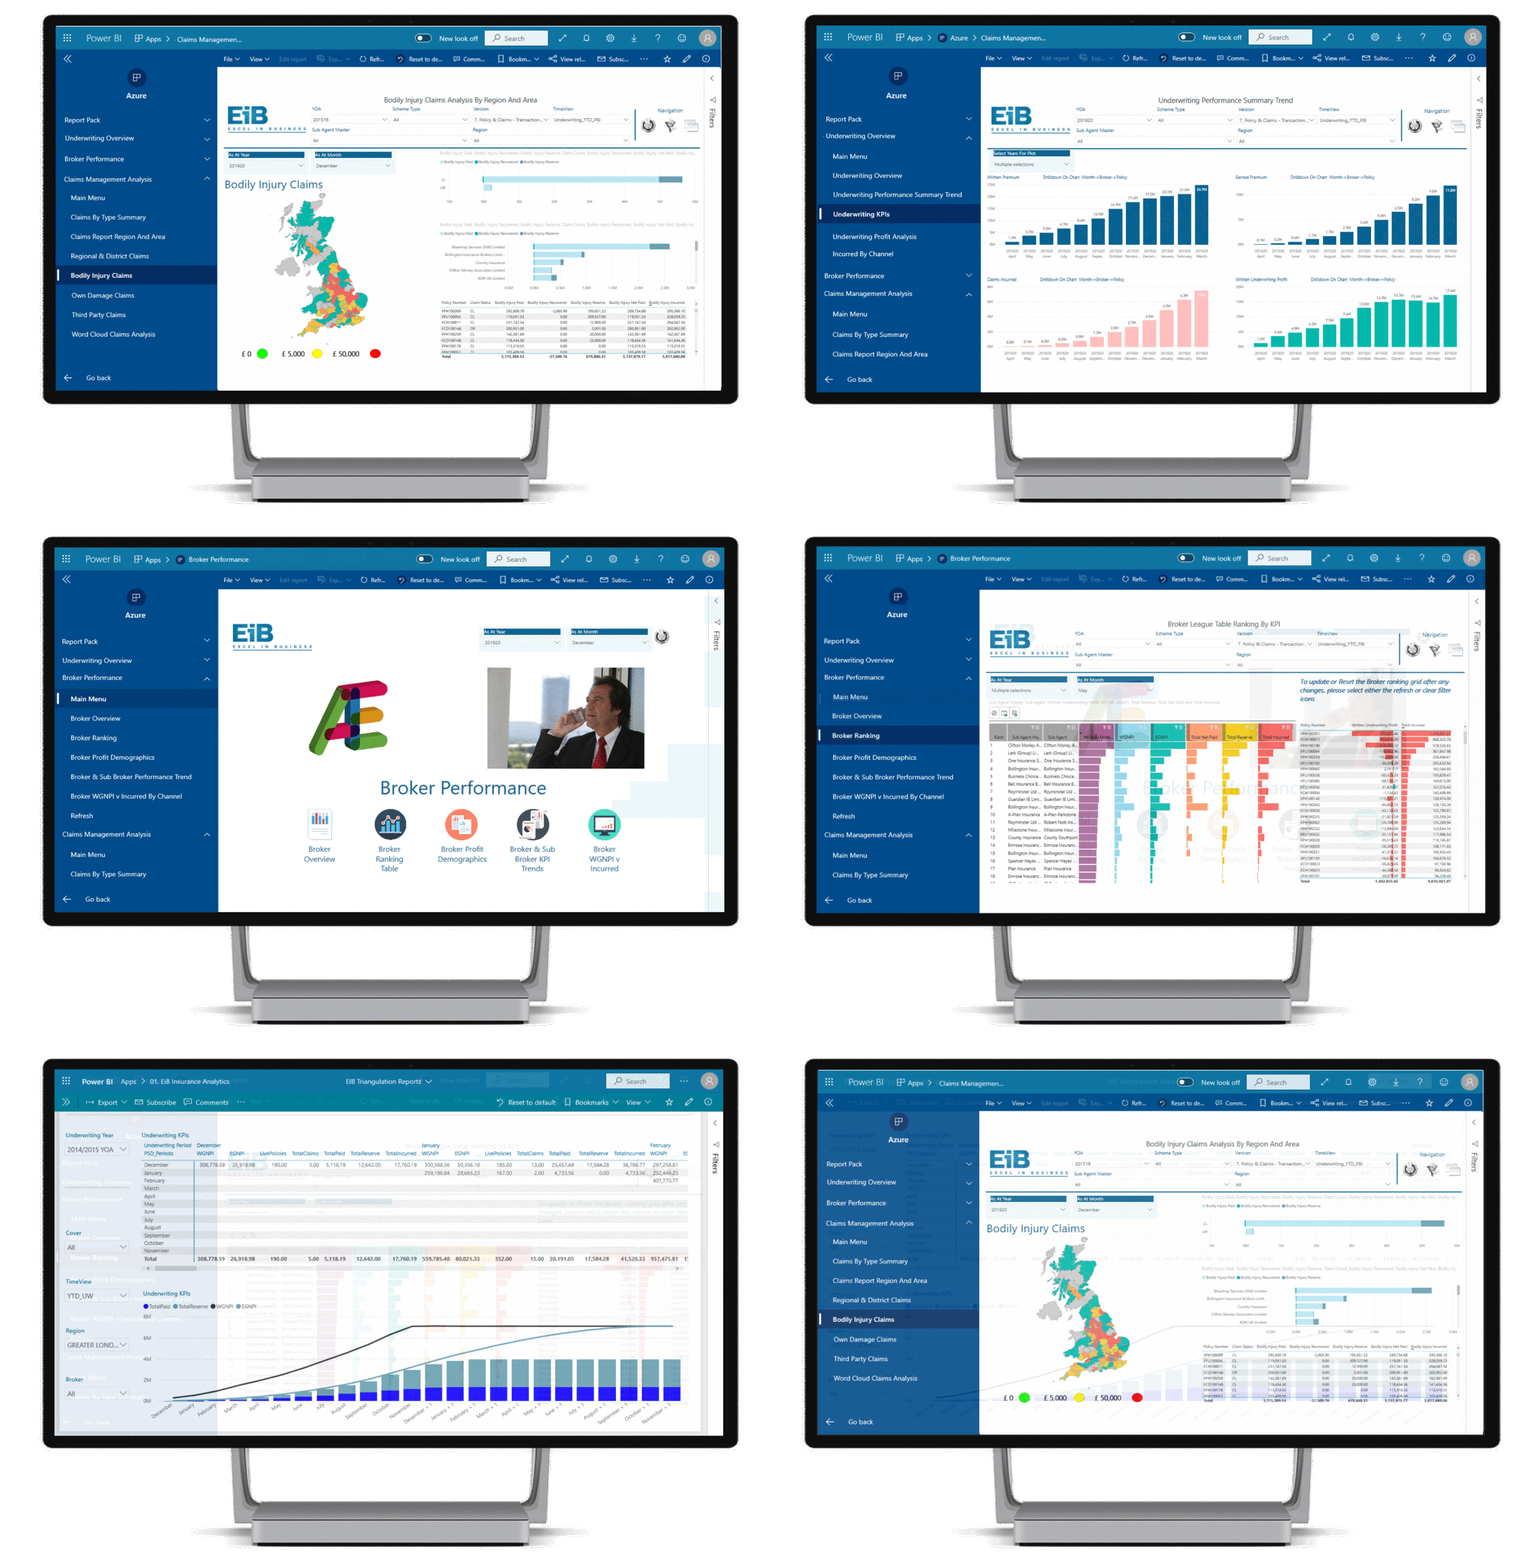
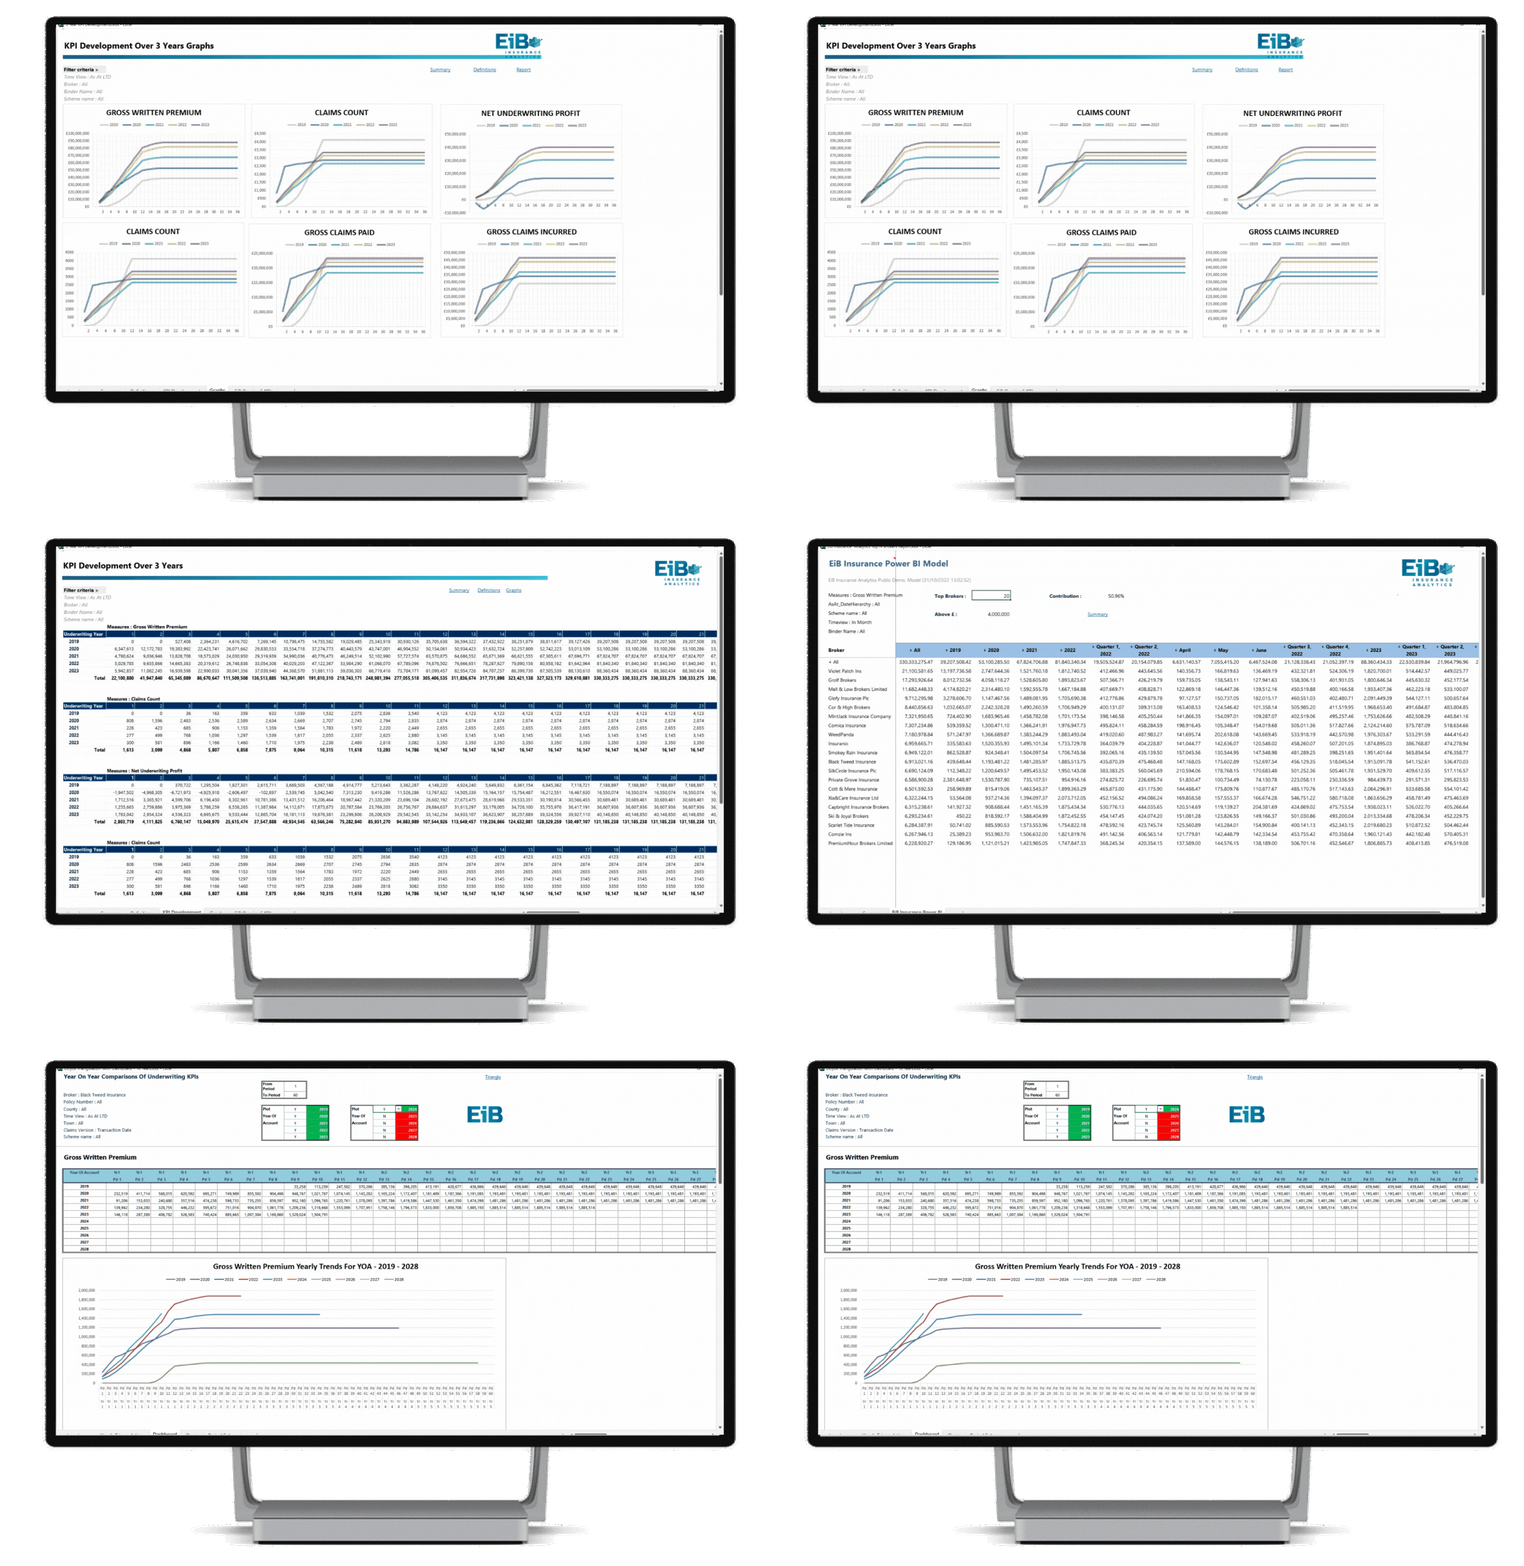
All fully interactive from within your end user tools of choice – Power BI and Excel. We also offer a set of AI Dashboards and Data Quality Dashboards as part of each Insurance MI app as standard, in essence everything you need.
Use our online demos below or download any Power BI dashboards or Excel reports you require as static Powerpoints or PDFs. All dashboards are live and you can change Year of Account, Broker, Product, Scheme etc

Are we saying any project can be delivered in 1 week? Of course not! It depends on the overall complexity of the app, the volumes of data, and for larger applications, integration of perhaps several different Policy Management and TPA Claims systems and/or Bordereaux files. Nevertheless, give us a single file format of Premium data and a single file format of Claims data per month:
and you’ll have your automated Insurance MI app in a week!
Unlike other BI solutions, EiB Insurance Analytics is not just the latest Business Intelligence offering loading and presenting your data. It is a pragmatic solution for error checking all your data and enforcing change. It improves quality and accuracy, before any numbers even hit a report or dashboard. It not only saves you from the process of gathering, sanitising, and analysing data manually, but also presents the sanitised key information in a clean, easy-to-read manner, allowing you to quickly monitor and evaluate your business performance, all without leaving Power BI and / or Excel.


Download our whitepaper “Insurance Analytics – Build, Buy, or Carry On With What You Have” where we will highlight the things you need to consider, accommodate and deliver.




Obviously there is vast diverse range of MI requirements based on the size and complexity of each Insurance organisation or Insurance ISV. To accommodate this our EiB Insurance Analytics product is provided in 3 Tiers – Professional, Teams and Enterprise.
The summary graphic below can be expanded with full cost information by downloading our EiB Insurance Analytics – Features and Benefits Excel model.
| BENEFITS | Professional | Teams | Enterprise |
|---|---|---|---|
| 1. Automated Insurance Analytics | ★★★ | ★★★★ | ★★★★★ |
| 2. Pre Built Insurance Power BI Dashboards | ★★★★★ | ★★★★★ | ★★★★★ |
| 3. Pre Built Excel Insurance Reporting Application | ★★ | ★★★ | ★★★★★ |
| 4. Pre Built Data Quality Power BI Dashboards | ★★★ | ★★★★ | ★★★★★ |
| 5. Data Integration & Enrichment Capabilities | ★★★ | ★★★★ | ★★★★★ |
| 6. Advanced Time Series Analysis | ★★ | ★★★ | ★★★★★ |
| 7. Complex Advanced Analytical Functionality | ★ | ★★★ | ★★★★★ |
| 8. Managed Manual Adjustments | ★★ | ★★★★★ | |
| 9. Built In Scalability | ★★★ | ★★★★ | ★★★★★ |
| 10. Built In Artificial Intelligence | ★★★★★ | ★★★★★ | ★★★★★ |
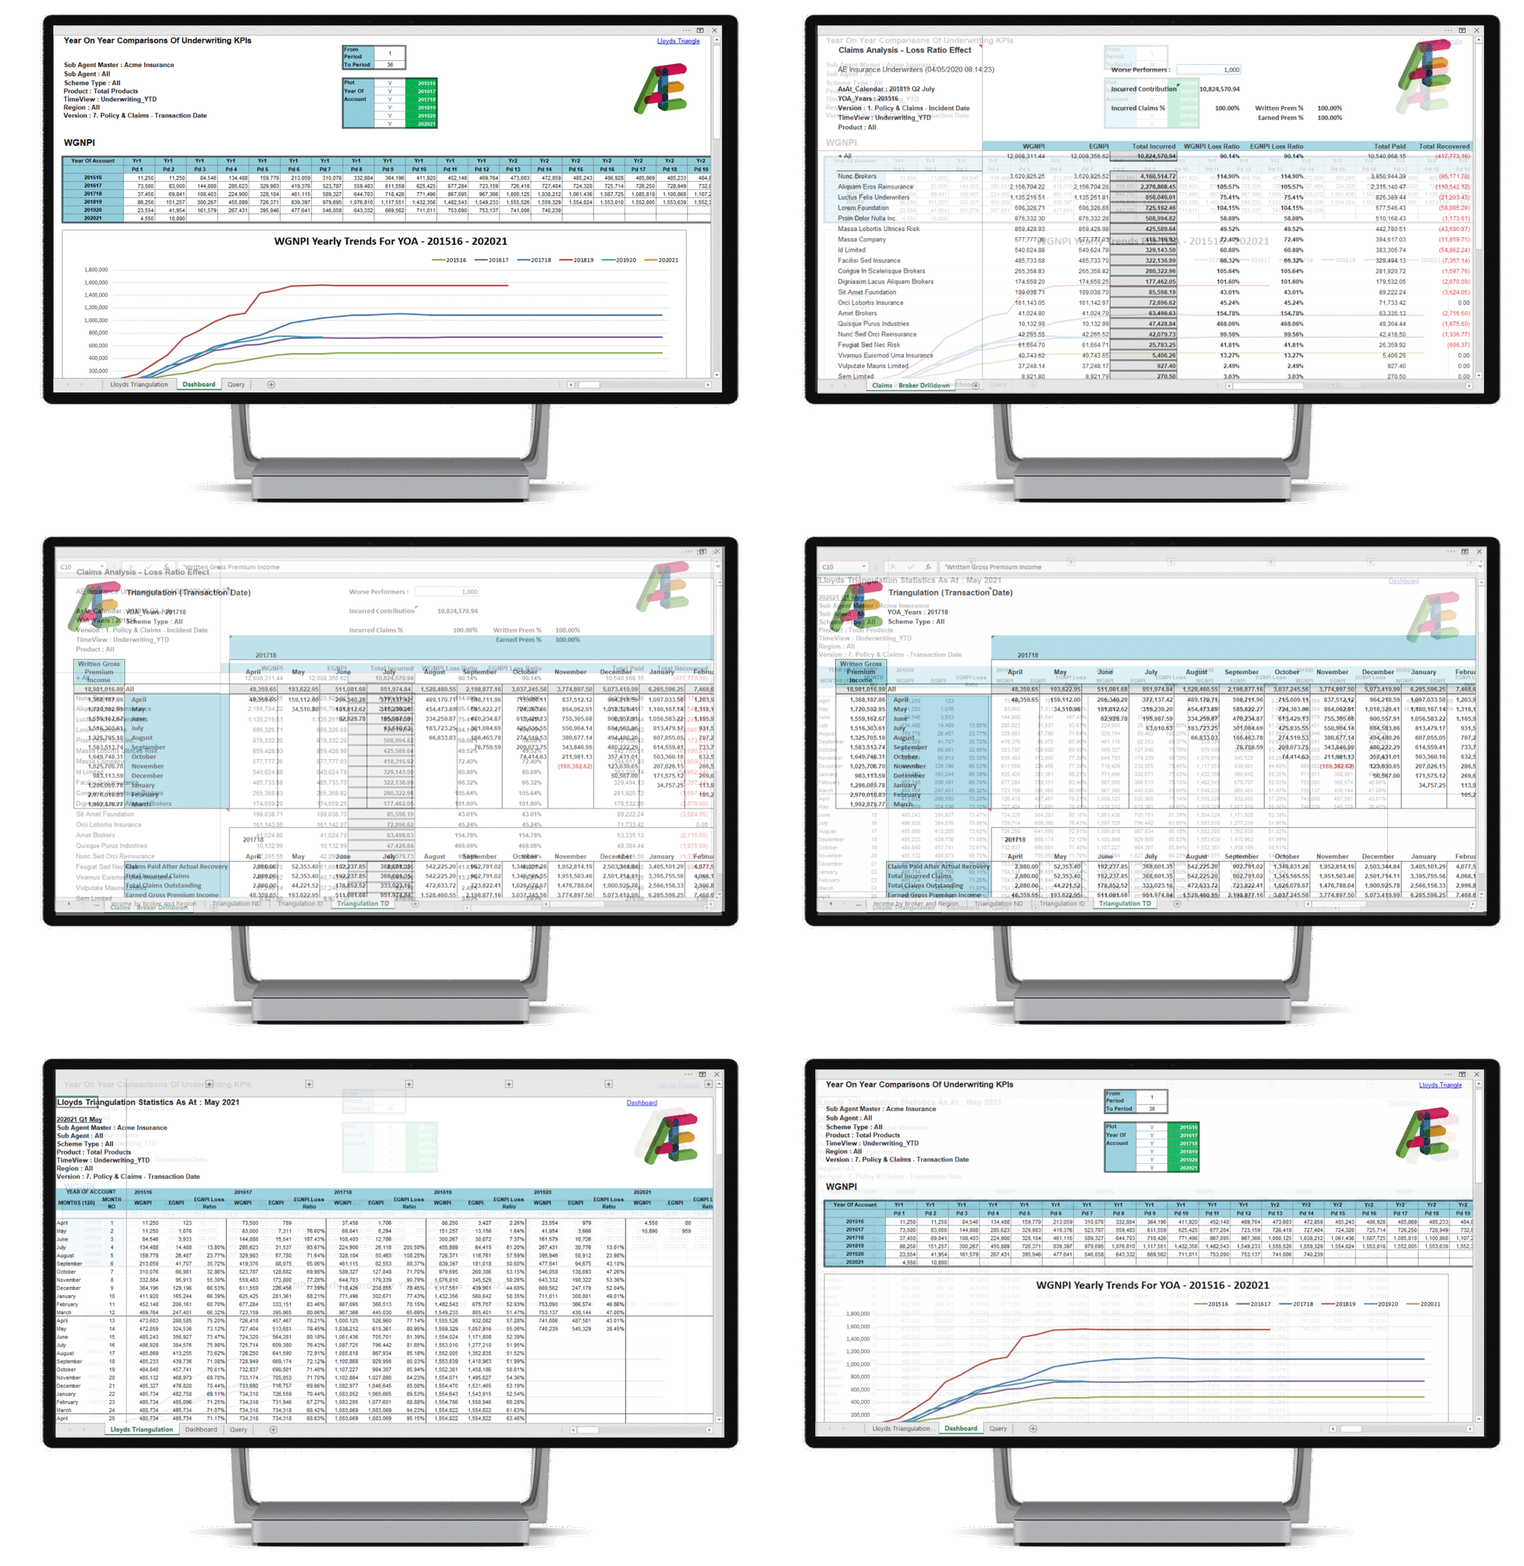
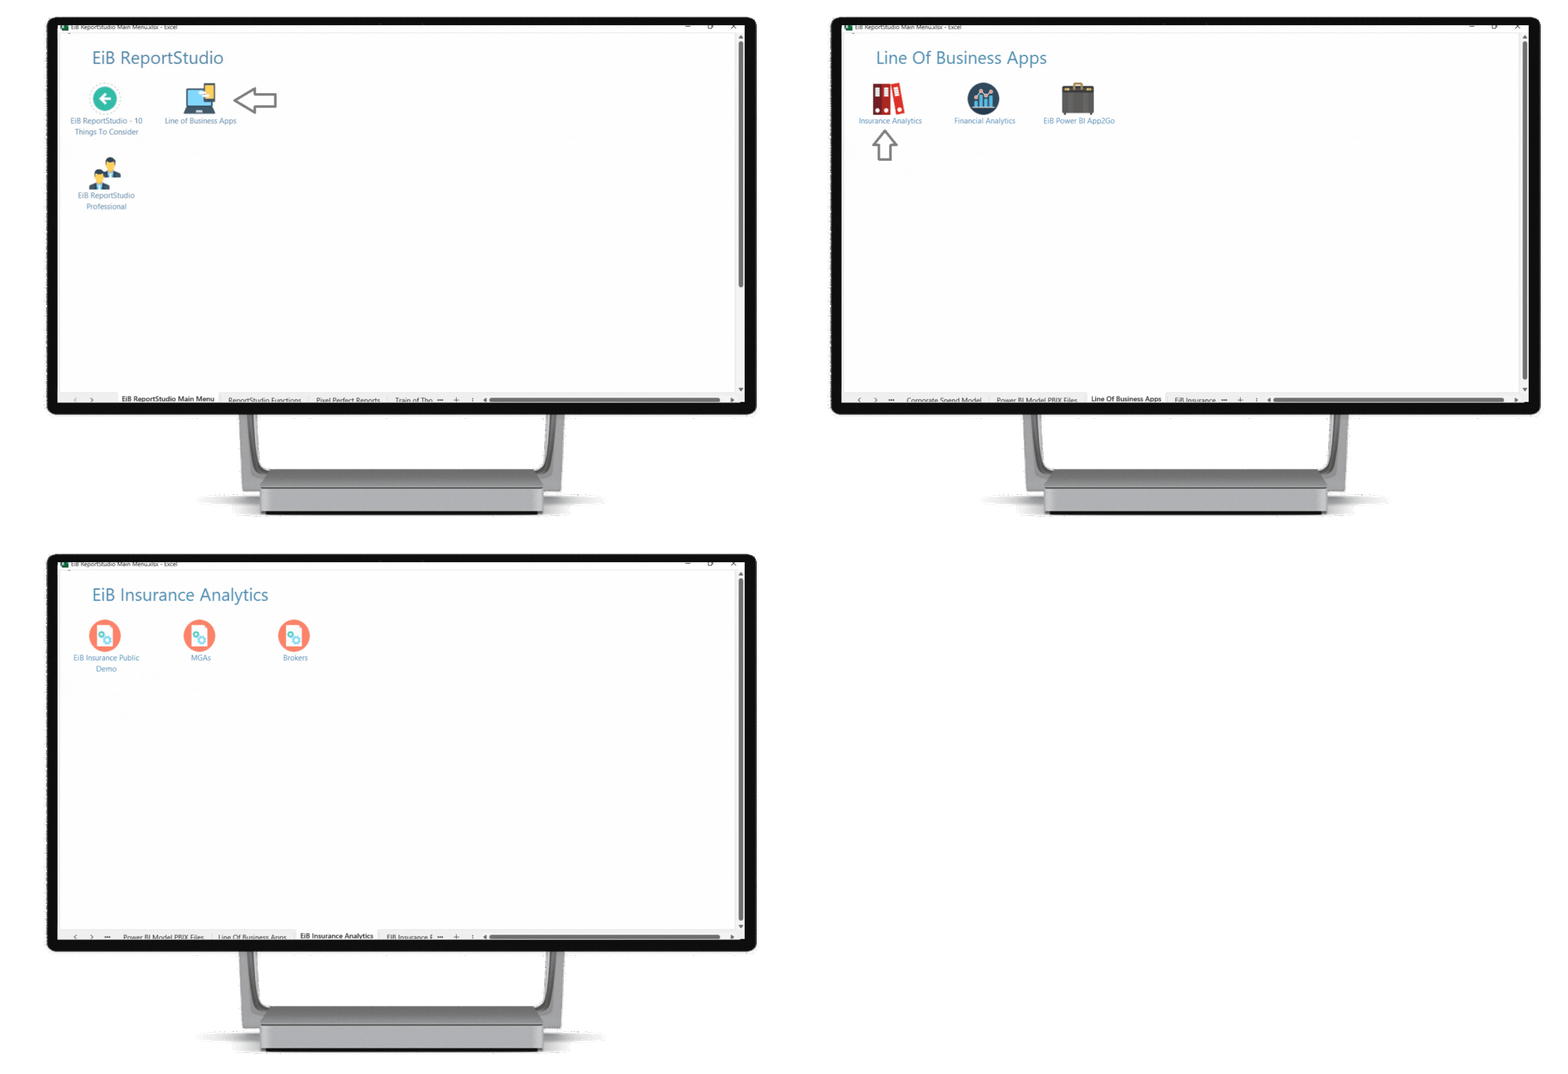
If you would like to use our Excel software and see how it can run Insurance reports interactively like the complex Triangulation report, then download our FREE EiB ReportStudio addin for Excel and from the menu, select Line of Business -> Insurance to test drive. Download
