In the field of data science, things can become very confusing, especially with so many buzzwords and terms flying around, it’s very easy to waste a lot of time just trying to figure out how everything connects together, let alone applying them to the day-to-day running of your business.
So, to clarify the relationships among the fields of business and data analytics, data science, business intelligence, machine learning, and artificial intelligence, Iliya Valchanov, founder of 365 Data Science, an educational start-up focused on data science, has built an Euler diagram to help us to understand how it all works a little better!
Throughout this post, we’ll explore how the diagram was created and how it illuminates these complex relationships with the help of different colours, a timeline, and example use cases.
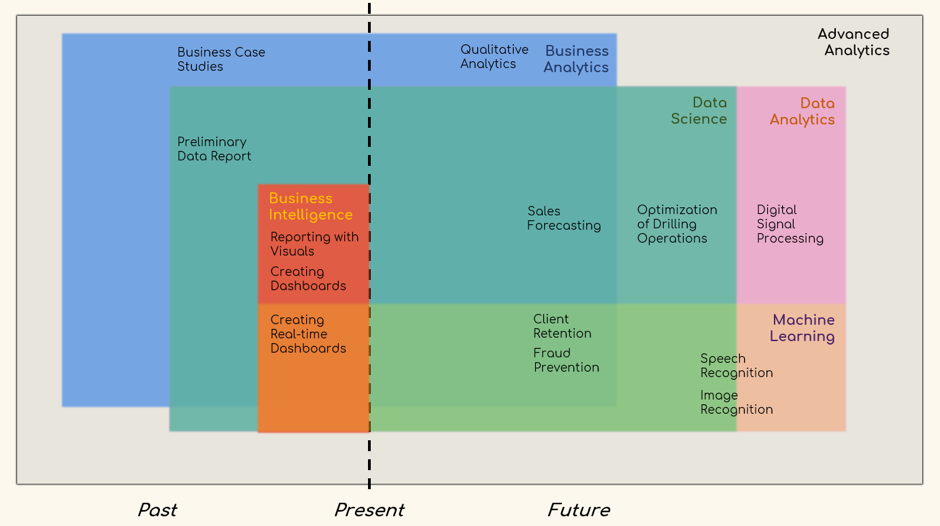
Here is the final version of the diagram, please keep in mind, the position and size of the rectangles show conceptual similarities and differences, not complexity.
 Business and Data
Let’s start with the business section of our diagram.
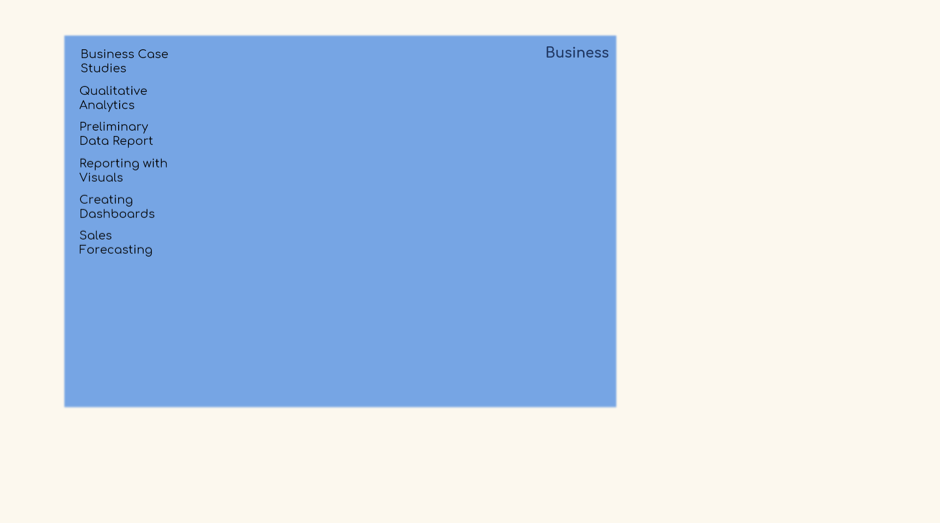
As you can see in the image above, the following activities relate to it:
- Business case studies
- Qualitative analytics
- Preliminary data reports
- Reporting with visuals
- Creating dashboards
- Sales forecasting
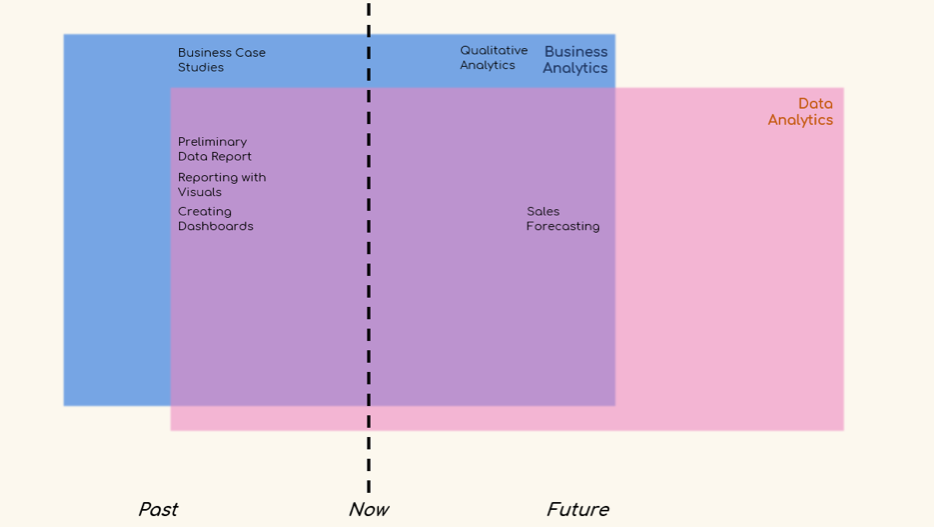
Some of these items are data-driven, while others aren’t. In the next diagram, you can clearly see this distinction: The blue rectangle contains activities related to business and the pink one to data. If something sits in the area that overlaps, then it is related to both fields. This will be true throughout the entire diagram.
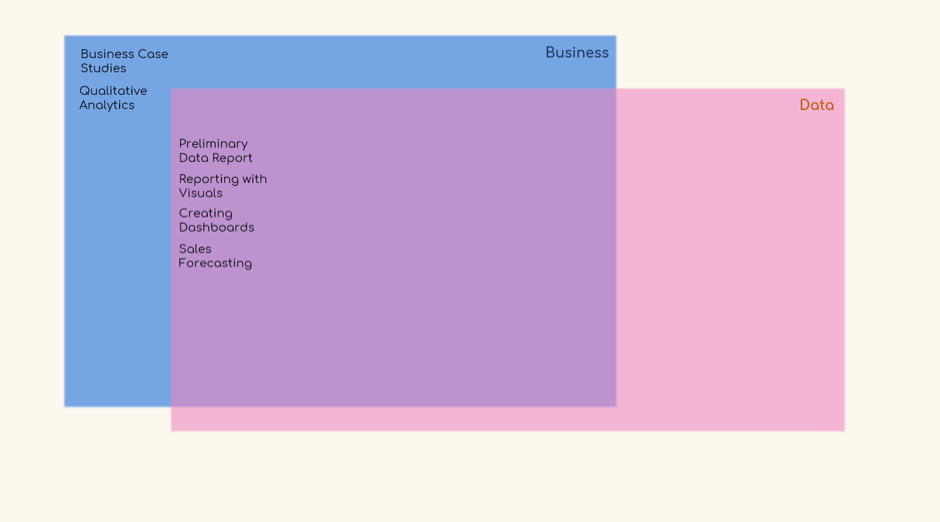
Of the six initial business activities, you’ll need data to create:
- A preliminary data report
- A visual representation of your company’s performance for last year
- A business dashboard
- A forecast of the future sales of your company
The other two items are experience driven:
- Business case studies
- Qualitative analytics
Neither of these two require data to be useful. Business case studies are examinations of past activities carried out in the real world (similar to those in a history book) and qualitative analytics relies on professional knowledge to assist in future planning.
Time
Time is an important feature that can greatly aid our segmentation.
Some of the terms you’ll see in our diagram refer to activities that explain past behaviour. Others refer to activities used to predict future behaviour. The next version of the diagram, which you can see below, introduces a line through the middle that signifies the present. Therefore, all terms to the right of this line are related to future-oriented analysis, such as forecasting. Those on the left are associated with the explanation of past events.
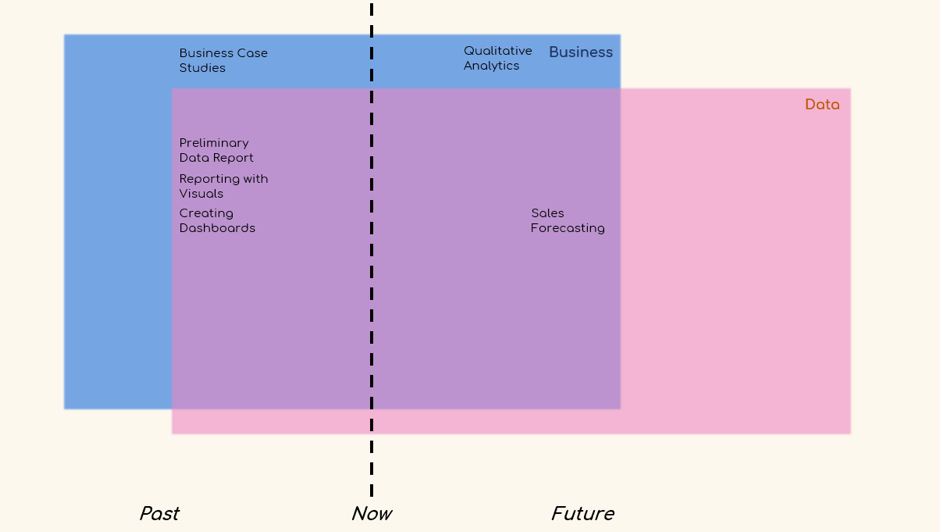
A quick refresher: Business case studies examine events that have already happened, so this activity is backward-facing. In contrast, qualitative analytics involves leveraging your knowledge and experience to predict future behaviour.
Preparing a report or a dashboard is always a reflection of past data, so these terms will remain on the left. Forecasting, though, is a future-oriented activity, so it sits to the right of the black line, but not too much — it still belongs to the field of business and remains in the area where business and data intersect.
Used in this context, industry professionals often refer to the business and data fields as data analytics and business analytics. Henceforth, that’s what we will call them in our diagram.
Data Science
After this long introduction you might be asking yourself: Where does data science fit into all of this?
Data science is completely reliant on the availability of data but not always on business. Data science (depicted here as a green rectangle), incorporates a portion of data analytics, mostly the part that uses complex mathematical, statistical, and programming tools.
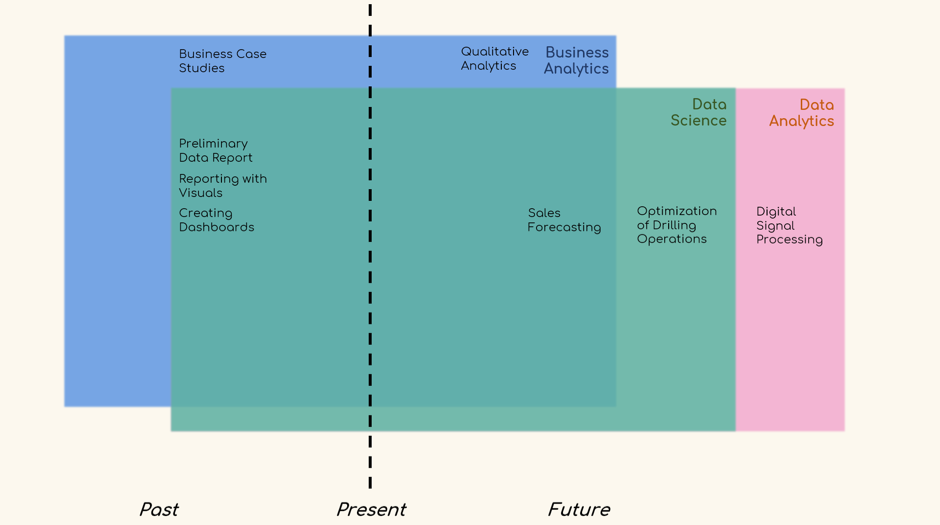
The full intersection of data analytics and business analytics lies inside the data science section, including our previously discussed terms.
So, what is an example of a data science activity that does not fall under business analytics? Well, “optimisation of drilling” within the oil and gas industry, while related to business, it is not a part of business decision making, per se.
To expand on the other areas on the diagram, “digital signal processing” is data analytics but not data science. We use digital signal processing when we represent data in the form of discrete values. There is data and mathematical transformations there, but no data science.
Business Intelligence
What about business intelligence?
In short, BI is the process of analysing and reporting historical business data. We will represent this concept with an orange rectangle:
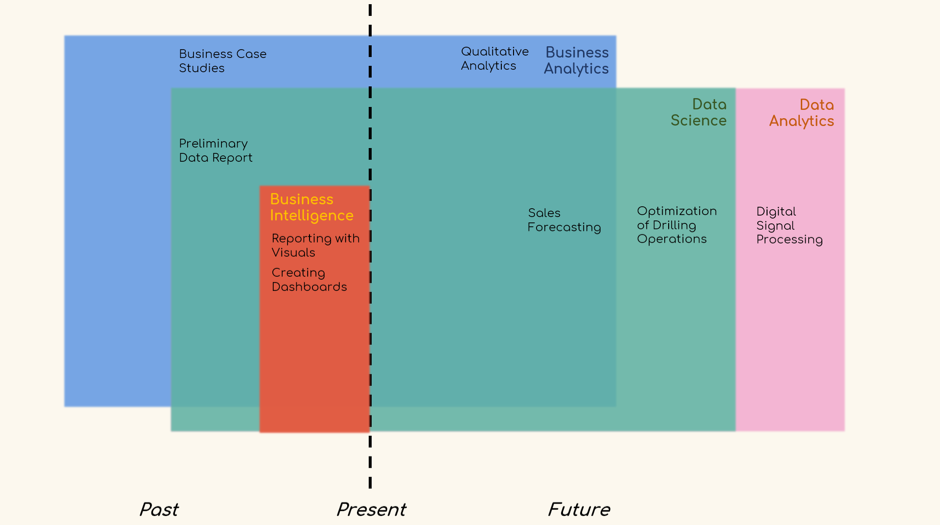
The orange rectangle goes on the left of the line indicating the present, as it only refers to past events. Also, BI sits within data science, as it consists of analysing past data and extracting useful insights. Conclusions may help for future planning, but make no mistake — no predictive analytics are involved!
In addition, informed strategic and tactical business assessments based on visual reports and dashboards are made by end users like general managers. This is what BI is, so they go into the orange rectangle.
Note that “preliminary data reporting” is the first step of any data analysis but does not include insights or “intelligence”; therefore, it remains in data science, but outside BI.
Machine Learning
Machines that are able to learn autonomously and predict outcomes without being programmed to do so are the essence of machine learning and artificial intelligence (AI). AI is the broader term and machine learning is, in fact, a subset of AI.
Let’s elaborate.
Machine learning is about creating and implementing algorithms that let machines receive data and use this data to analyse patterns, make predictions, and give recommendations on their own. It is an approach to AI, but not AI itself.
The confusion comes from the fact that so far, for all practical purposes, machine learning is the only path to AI that humans have managed to develop.
Here’s the version of the diagram where these two fields join with the others:
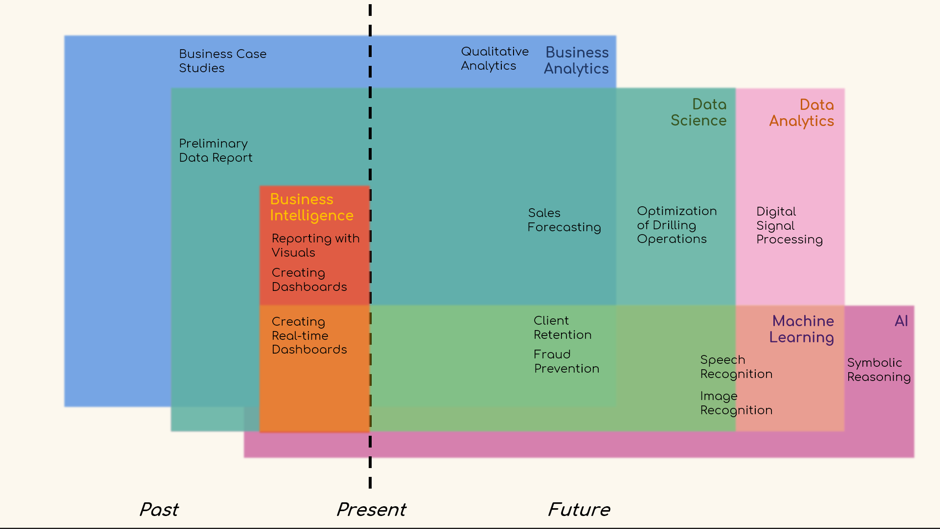
It’s worth noting that some argue that data analytics and machine learning are two unrelated scientific fields. But machine learning would not be possible without data; hence, it should stay within data analytics completely.
Furthermore, machine learning should expand slightly to the left of the vertical line indicating the present. The reason for this is that industry professionals have been increasingly applying machine learning to the context of business intelligence. We are interested in how machine learning tools can help us improve the accuracy of our analysis, even when no predictive analytics are involved.
There are two very typical business activities where machine learning plays a big part. The first is client retention and acquisition, which uses machine learning to develop models that predict what a client’s next purchase will be.
Secondly, machine learning is also employed to prevent fraud. Past fraudulent activity data can be fed to the machine, which will find patterns that the human brain is incapable of recognising, all in real time — an approach that has helped financial organisations prevent numerous criminal acts.
Speech and image recognition are widely discussed right now, but there is debate over whether they belong under the umbrella of data science, data analytics, both, or neither. For the most part, they are out of the realm of business and, although worth mentioning, we will remove them from the diagram to avoid confusion.
AI itself has been interpreted in quite a philosophical manner at times and although we have only achieved AI through machine learning, there is a part of the field that sits outside of this realm. For the sake of completeness, an example that is AI but not machine learning is symbolic reasoning.
Symbolic reasoning is based on high-level human-readable representations of problems and logic. It was a trend in the past when people were trying to create human-like intelligence. Today though, machine learning is king and symbolic AI is rarely encountered.
So, along with speech and image recognition, this can be removed, too, in order to create a neat diagram.
Advanced Analytics
The final touch to this diagram is advanced analytics.
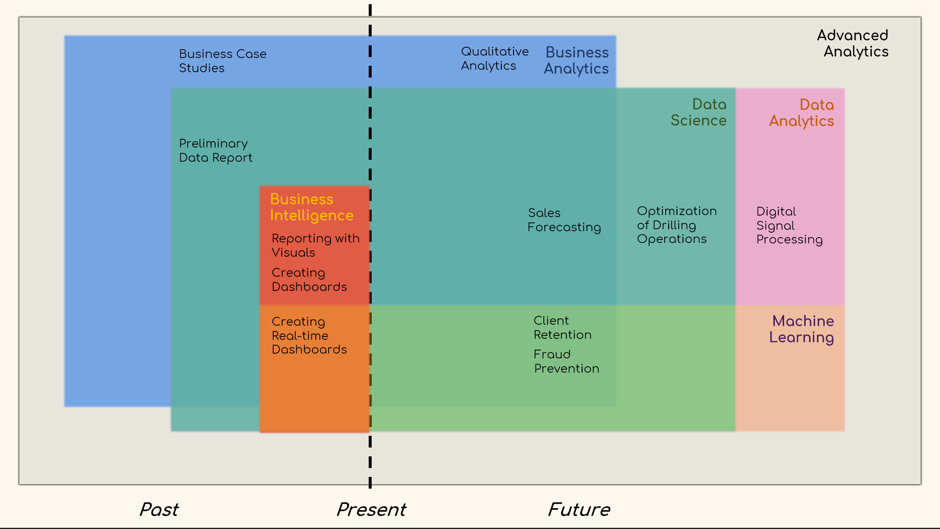
Advanced analytics is a marketing term that comes from people who want to say that the type of analytics they are dealing with is not easy to handle.
However, “advanced” is a subjective term. Any part of what has been discussed could be defined as advanced, so, to keep things fair, advanced analytics shall encompass our entire set of fields.
Final Notes
All areas intertwine, and what is shown here is not a strict representation of the commonly-accepted meanings and definitions of the fields we’ve discussed. It is all matter of interpretation, and this diagram is Ilya’s vision of data science. The locations of some of the components might be controversial; however, in Ilya’s opinion, this is a very comprehensive depiction of what these disciplines are about and how they overlap.
For a fresh, dynamic look at our diagram, check out this video we’ve put together:
Author: Iliya Valchanov
Original Source: DataScience.com


